Digital bulletin vs. digital poster: telling them apart in satellite imagery
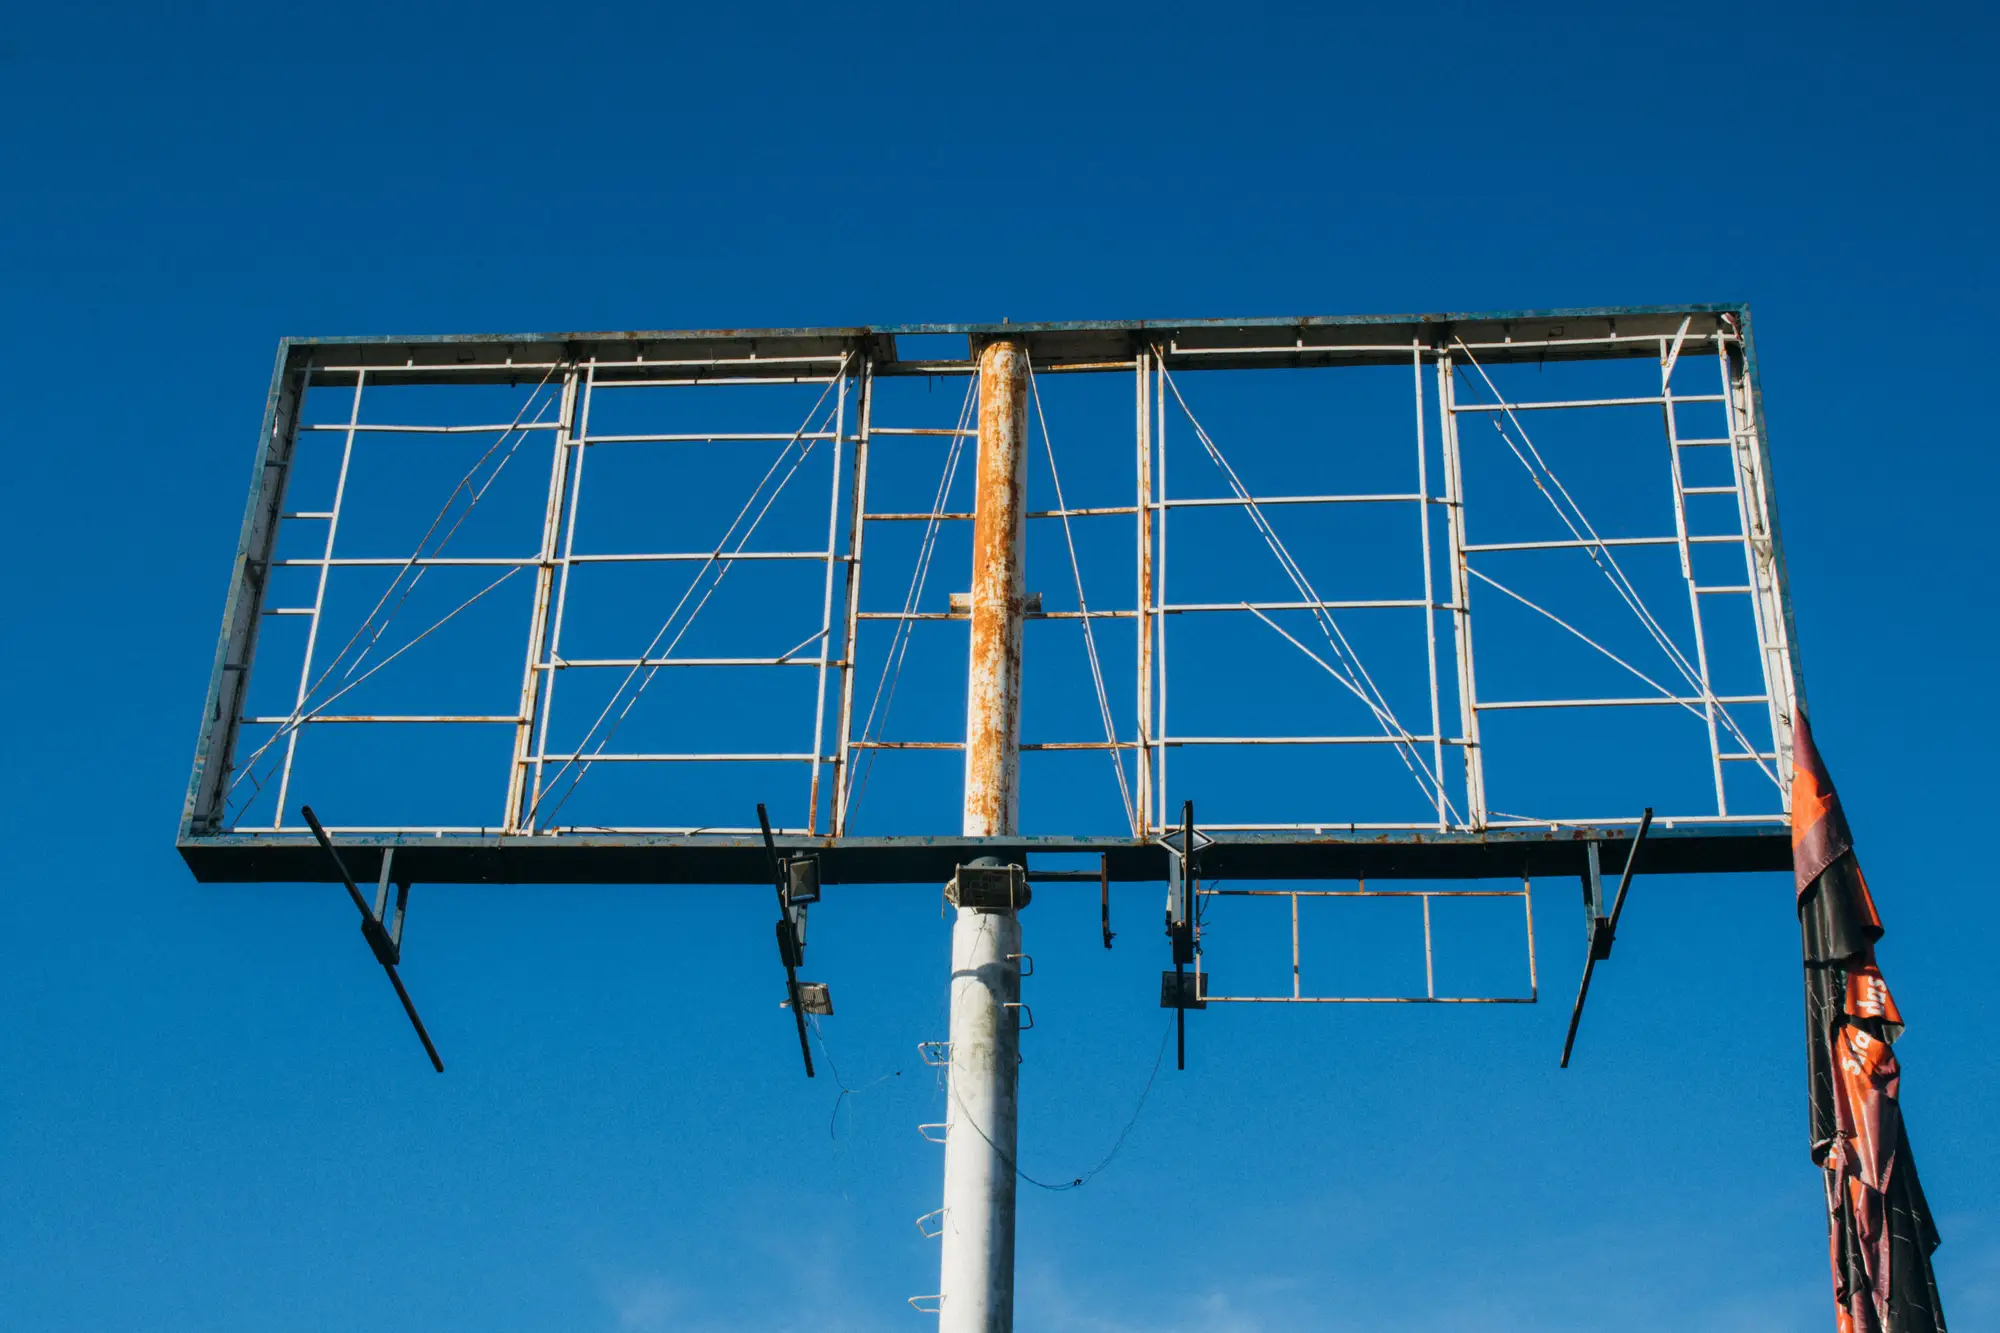
An analyst doing a desk audit from imagery is working with a different set of clues than someone standing at the base of a structure with a tape measure. You can't read a permit plaque from an overhead pass. What you can read is footprint, mount height, setback from the road, and shape, and those four things get you most of the way to sorting bulletin inventory from poster inventory without sending a crew out.
Face size is still the fastest tell
Digital bulletin panels tend to run close to the old 14x48 standard, with some markets drifting toward 10.5x36 or 14x40. Digital posters run smaller, usually in the 12x24 junior-poster range or the smaller street-level panels bundled into kiosks and transit shelters. In VHR imagery you're not reading a spec sheet, you're reading a footprint against something nearby you can use as a ruler: a lane width, a parked trailer, a rooftop HVAC unit. A panel with a long edge north of 40 feet, mounted high on a single pole, reads bulletin. A panel under 25 feet, sitting low and close to the curb, reads poster. Digital billboard face size is the single most useful variable for this sorting pass, and it's the one most legible from above.
Mount height and setback do the rest
Bulletins live on a highway sightline. They're set back from the road to build in read time at speed and mounted high enough to clear trees, signage, and overpasses. Posters sit closer to the road and lower to the ground, aimed at arterial and local traffic that's already moving slower. From imagery, shadow length relative to the time stamp gives you a rough proxy for mount height, and the distance between the structure's base and the edge of pavement gives you setback. A face sitting well off a limited-access highway with a long shadow is probably a bulletin. A face a few feet off a four-lane arterial with a short shadow is probably a poster.
Where digital spectaculars break the pattern
Spectaculars don't follow either rulebook. They're custom builds, often irregular shapes, sometimes multiple faces wrapped around a building corner or stacked on one structure in a dense market like a stadium district or downtown core. In imagery they show up as clusters of panels at odd angles rather than one rectangular face on a pole, and that cluster shape is usually the tell. When you're trying to sort a detected structure into bulletin, poster, or spectacular, panel count and angle spread matter as much as footprint size.
What imagery can't tell you
A satellite or aerial pass can't confirm a panel is digital just by looking at it. There's no way to read screen content or refresh rate in an overhead image, and a static bulletin and a digital bulletin of the same dimensions look identical from above. What structural cues can give you, panel proportions, mount type, an electrical service cabinet or pad visible at the base, is a strong inference, not a confirmed digital flag. Digital face classification from imagery alone has a ceiling, and any tool claiming to read screen state from a satellite pass is overselling what the pixels show.
Where this fits into an audit
None of this replaces a lease file or a field check on a face someone's trying to sell against. What it does is get you a fast, defensible first pass across a region before you decide where the field time goes, and it's a useful way to flag faces that don't match what's in the ledger. Billboard Mapping is building out an early-access inventory layer that detects faces across a region and reports location, orientation, and rough approach visibility for each one, so a desk pass like this doesn't start from a blank map.
If sorting your own inventory, or scoping a competitor's, from imagery instead of a windshield survey sounds useful, get on the early access list.